
Automating Grocery Expense Tracker Using n8n
How I built a self-hosted n8n workflow from scratch
Gokhul Gopinathan
11/20/20253 min read
The best thing about n8n is how easy it is to get started. It is straightforward to set up and getting a workflow running. And it is free, FOREVER. But why do you even need n8n? Honestly, you will discover your own use case the moment you start exploring it.
NOTE: I have linked all the important resources at the end of the blog.
Step 1:
Use Docker to self-host n8n. It’s absolutely free, and you can immediately start building cool stuff.
Step 2:
Set up credentials for your nodes. The node documentation takes you straight to the “How-To” page. If you prefer video tutorials, YouTube has tons of content covering pretty much everything about n8n.
Step 3:
Start exploring nodes in n8n. Build random workflows. Then identify a use case.
Step 4:
Setting up a permanent n8n host server. You can continue building on a Docker-hosted n8n instance and trigger workflows manually - works perfectly. But if you need automatic triggers, you’ll have to host n8n on a VPS that runs continuously, because it’s tough to keep your laptop/PC and Docker running 24/7 for automatic executions.
I already had my personal website on Hostinger, and it turned out Hostinger had a straightforward n8n VPS setup.
So, I moved my workflows from self-hosted Docker to a VPS on Hostinger.
My Use Case:
I buy groceries from Rewe and have the eBon service activated. So, I get my grocery bill as a PDF directly in my email.
I figured I could track my grocery expenses and see how inflation affects my spending month over month.
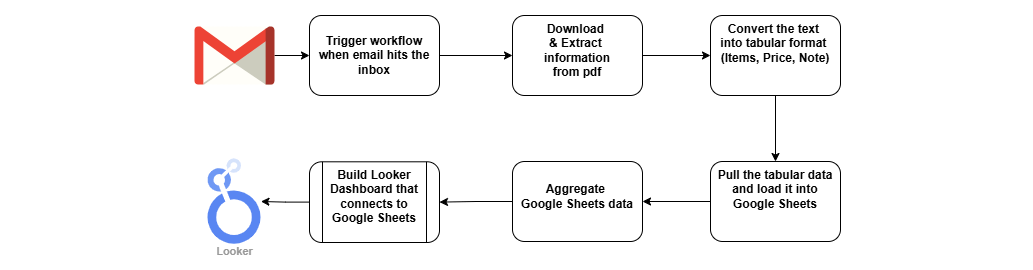
To get an overview, I sketched the workflow on draw.io.
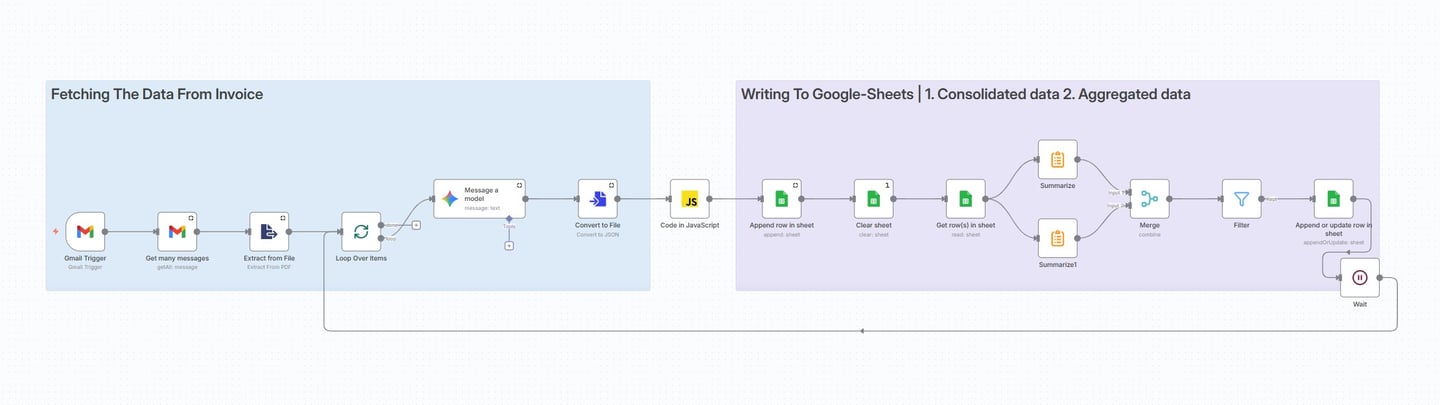
Then I looked for nodes that could perform each step. I knew OpenAI/Gemini APIs could convert text to JSON, which I could then push into Google Sheets as a table.
I used a JavaScript code node to map the JSON to table columns; ChatGPT wrote the code, so no sweat.
Once the raw data was loaded into Google Sheets, I also needed a transformed and aggregated version since Looker Studio isn’t great at heavy data processing. So, I added a few summarize, merge, and filter nodes to wrap things up.
And that was it, the workflow was complete and active.
Lessons Learned:
My first data pull had over 36 emails. That meant processing 36 PDFs. Both the Gemini API and Google Sheets API have rate limits, so I had to loop through the files one by one and include a wait node (60 seconds) to slow things down.
When using Gemini Chat, attaching a PDF and asking for an Excel-ready output works beautifully. So technically, a single Gemini node should have been enough, but not really. Using “Analyze Document/Image” directly on the PDF caused hallucinations and random data. Gemini handles text better than PDF/image in n8n, so extracting text with a PDF-to-text node before the LLM worked perfectly. Asking the LLM for JSON output was also more accurate and consistent. I then used a JavaScript node to convert JSON to Excel.
I buy groceries once a week, precisely Saturday mornings, so running the workflow weekly made sense. I set it to run every Saturday at 12 p.m. Looker Studio refreshes the data automatically whenever the dashboard opens, so everything stays up to date.
Have fun with n8n!!!
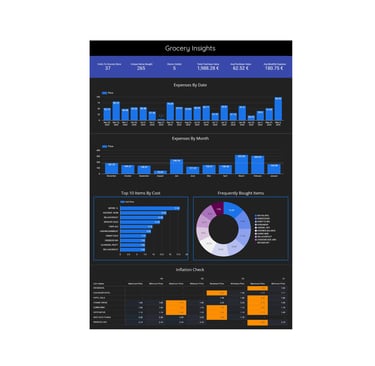
Also, my Looker dashboard looks like this. You can also access the dashboard HERE

© 2025. All rights reserved.